


The Morgan Stanley Dry Van Freight Index is a good measure of relative supply; the higher the index, the tighter the market conditions. The black line with triangle markers on the chart provides a great view of what directional trends would be in line with normal seasonality based on historical data dating back to 2007.
Like other truckload supply measures, normal seasonal trends typically indicate tightening between mid-May and July Fourth. This year’s data illustrated what we would expect, with conditions getting tighter in the back half of May and early June. The data shows more market volatility than contract tender rejection trends indicate, which supports the idea that carriers are sticking to their contractual commitments despite the seasonal spot demand uptick. Normal seasonality would lead us to believe that conditions may continue to tighten as we approach Independence Day but should begin to ease in the weeks following.
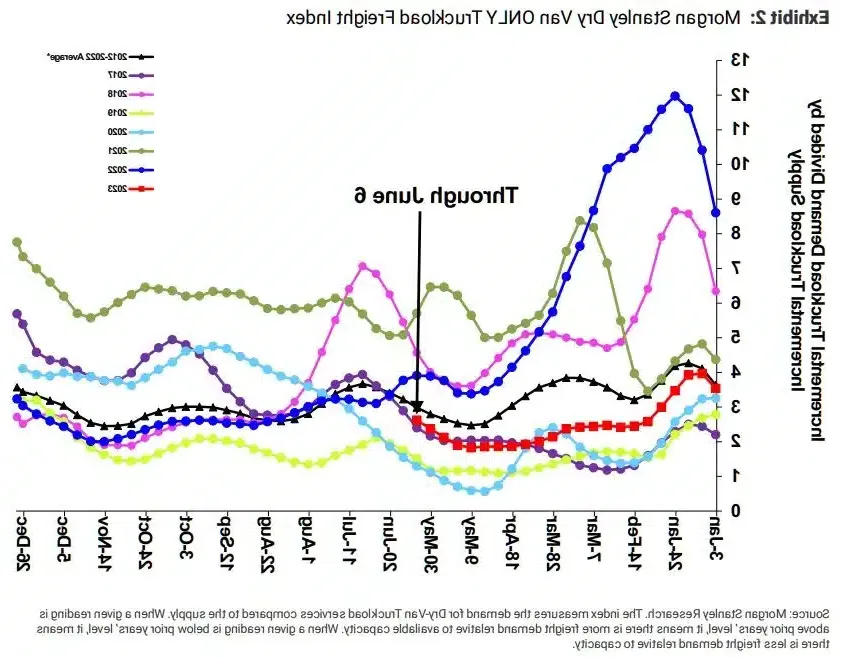
Figure 1: Morgan Stanley Dry Van Truckload Freight Index
 Figures 2 & 3: Morgan Stanley Reefer and Flatbed Truckload Freight Indices
ACT’s For-Hire Index of Supply and Demand represents overall market sentiment. The most recent reading came in at 35.8, down from 42 in March, making it the lowest of the current downcycle and the 14th in a row showing loosening conditions. These results are likely due to volume declines and capacity growth. However, there are signs that volume increases may begin to outpace capacity growth, indicating the market could be entering a phase of normalization.
 Figure 4: ACT For-Hire Trucking Survey
The back half of May and early June showcased where we are in the overall capacity correction cycle. As expected, certain pockets and regions experienced some seasonal spot rate volatility. However, this had little to no impact on tender acceptance and service for shippers as carriers continued to show a strong interest in and ability to support current contractual freight demand.
The Sonar Outbound Tender Reject Index (OTRI) measures the rate at which carriers reject the freight they are contractually required to take. The rate remained relatively flat in May, hovering between a low of 2.5% and a high of 3.25%, indicating routing guide compliance on contractual freight was still historically high for shippers.
Both van and reefer tender rejections held steady throughout May, but reefer tender rejections increased rapidly over the last week, indicating tightening conditions for the equipment class in line with normal seasonality. At 5%, the rejection rate is still an all-time low for this time of year but is nearly double the mid-May low of 2.6%.
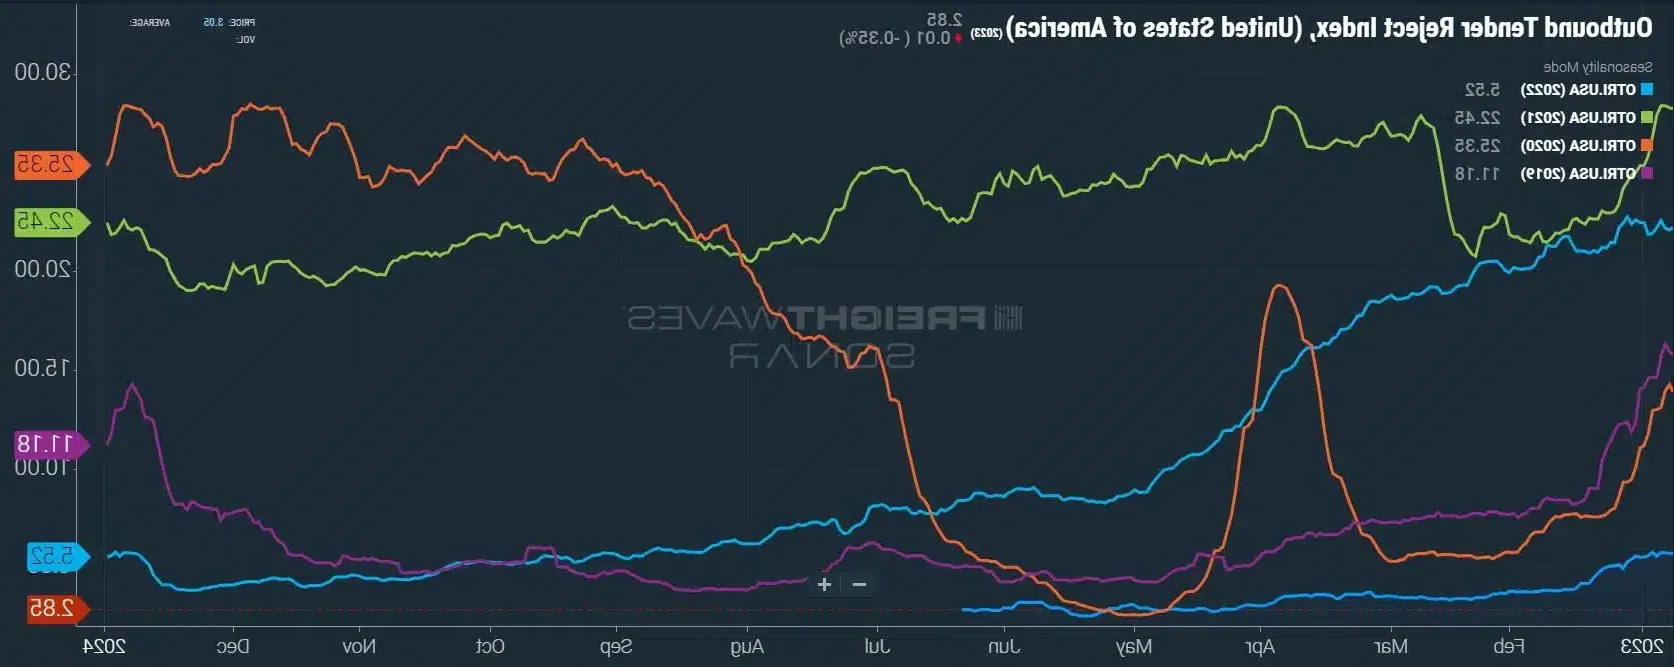 Figure 5: Outbound Tender Reject Index (SONAR)
According to Sonar’s Contract Load Accepted Volume Index (CLAV), June volumes remain down from a year-over-year perspective, staying in line with seasonal expectations and aligning precisely with June 2020 figures. Based on seasonality, expect volumes to stay flat as we approach July Fourth and be elevated through the summer.
 Figure 6: Contract Load Accepted Volume (SONAR)
The DAT Load-to-Truck Ratio measures the total number of loads relative to the total number of trucks posted on their spot board. May data was consistent with typical seasonal pressures: The Dry Van Load-to-Truck Ratio was up 32% month-over-month but down 43% year-over-year, and the Reefer Load-to-Truck Ratio was up 34% month-over-month but down 52% year-over-year.
 Figure 7: DAT Trendlines, National Load-To-Truck Ratio
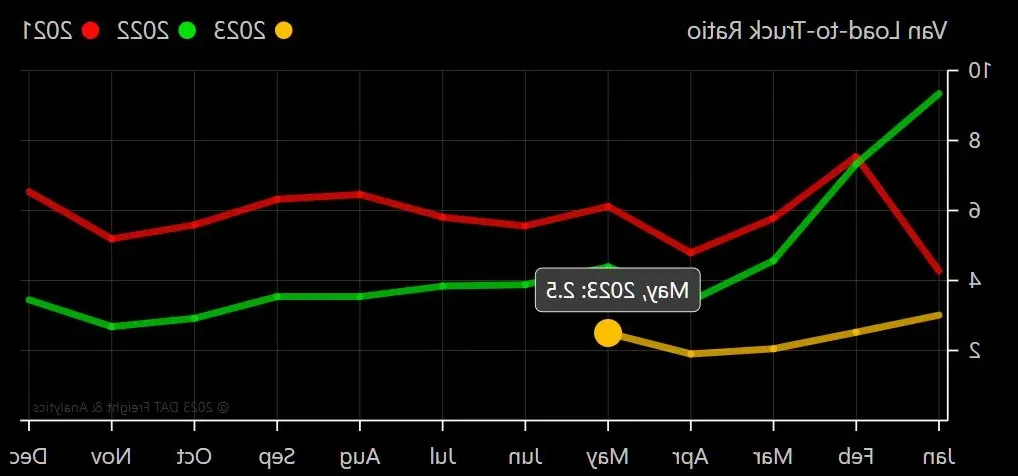 Figure 8: DAT Van Load-To-Truck Ratio
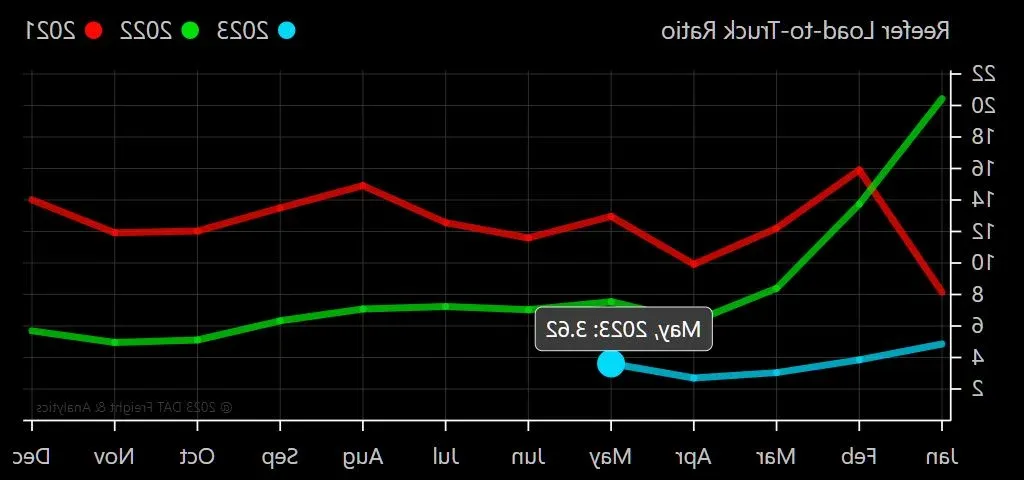 Figure 9: DAT Reefer Load-To-Truck Ratio
A key trend we’re still watching is revocations outpacing new carriers entering the market for seven of the last eight months, reducing the total number of carriers. A significant amount of capacity that entered the market over the last few years remains unutilized, so we expect this disparity to continue for at least the near term.
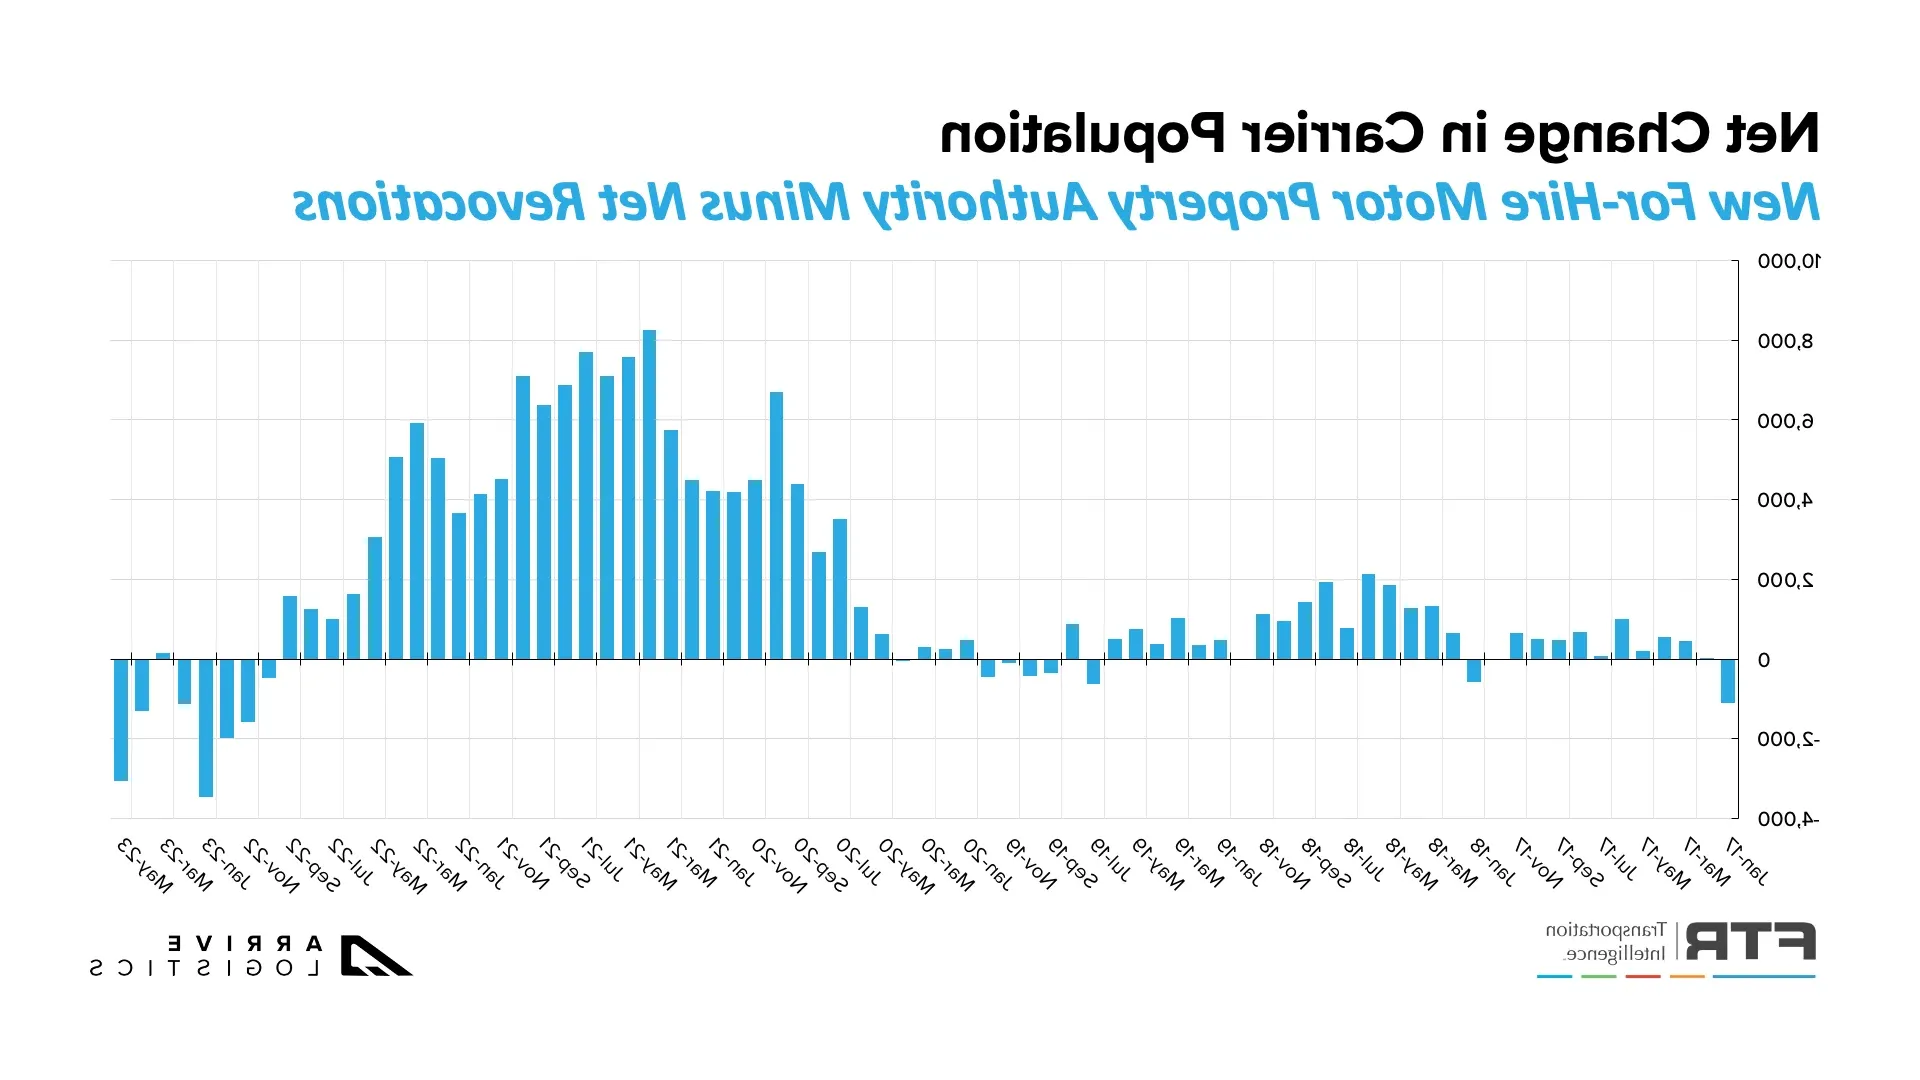 Figure 10: Net Change in Carrier Population: FTR Analysis of FMCSA Data
According to the most recent reading from ACT Research, the Class 8 Tractors backlog fell by about 12,000 units in May. Overall, the backlog dropped to approximately 122,000 as production continues to outpace orders. The backlog-to-build ratio fell from 7 months in April to 6.4 months in March. Although data for June is not released, we expect a month-over-month decline similar to the past few months as build rates continue to improve.
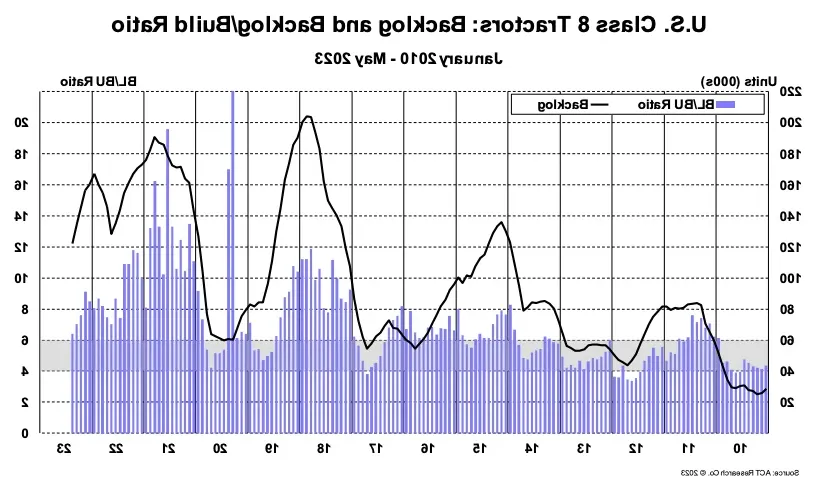 Figure 11: ACT U.S. Class 8 Tractors Backlog
According to FTR, new Class 8 truck orders rose 18.4% month-over-month in May, rising to 13,600 and bucking the trend of declining orders and was just the second month-over-month increase since September 2022. Although orders are down compared to peak-pandemic levels, they align with 2019 averages. Despite the slight increase, backlogs are likely to continue shrinking as build levels hold steady.
 Figure 12: New Class 8 Truck Orders: DataSource: FTR
Since November 2021, the ACT For-Hire Capacity Index has recorded capacity expansion for 18 consecutive months. In March, month-over-month capacity growth declined by 0.8 points but remains above 50 and now sits at 51.8.
Improving supply chains and the rise in completed new truck orders continue to support capacity. It is important to remember that this data primarily consists of larger fleets and may not be a perfect reflection of what small and mid-size fleets are seeing.
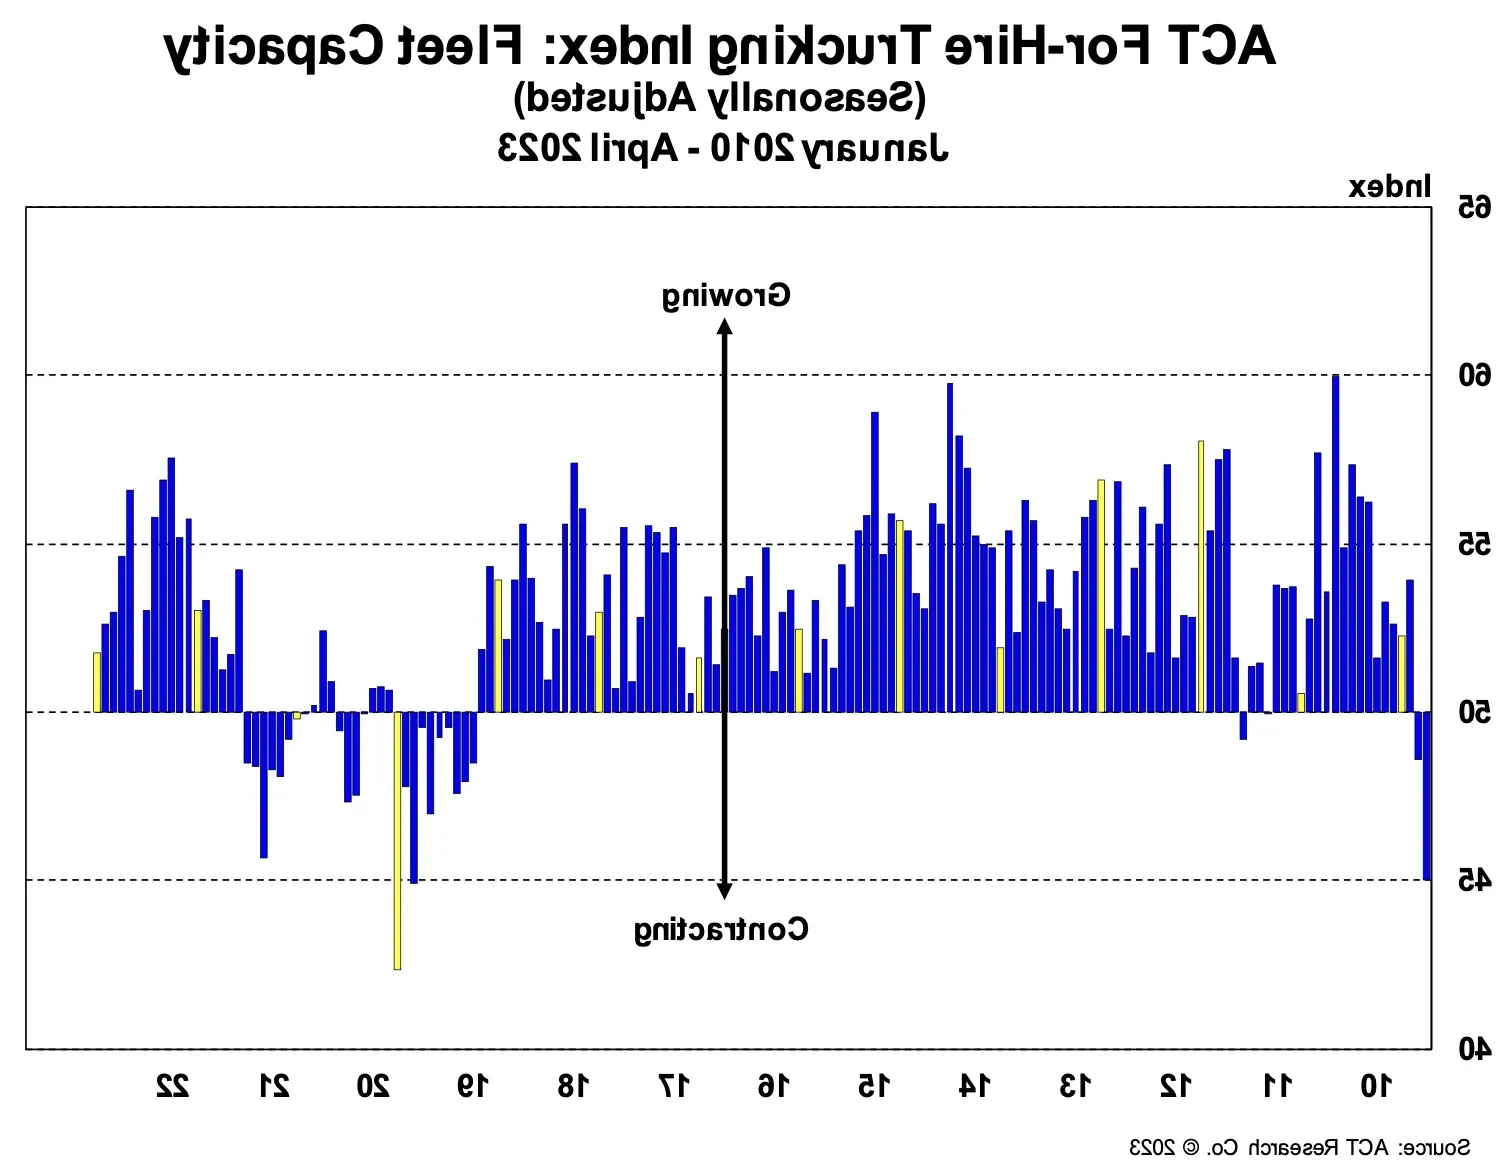 Figure 13: ACT For-Hire Trucking Index: Fleet Capacity
The trucking sector job market showed month-over-month growth in May. However, it’s important to note that revisions to the previous month were lower by more than 3,000 jobs, and total employment is below what it was in January 2023. So, while job growth continues to defy expectations given the declining truckload rate environment, long-term trends point to more of a plateau for trucking employment, potentially due to carriers having cash reserves on hand due to the highly elevated rates seen in the past few years.
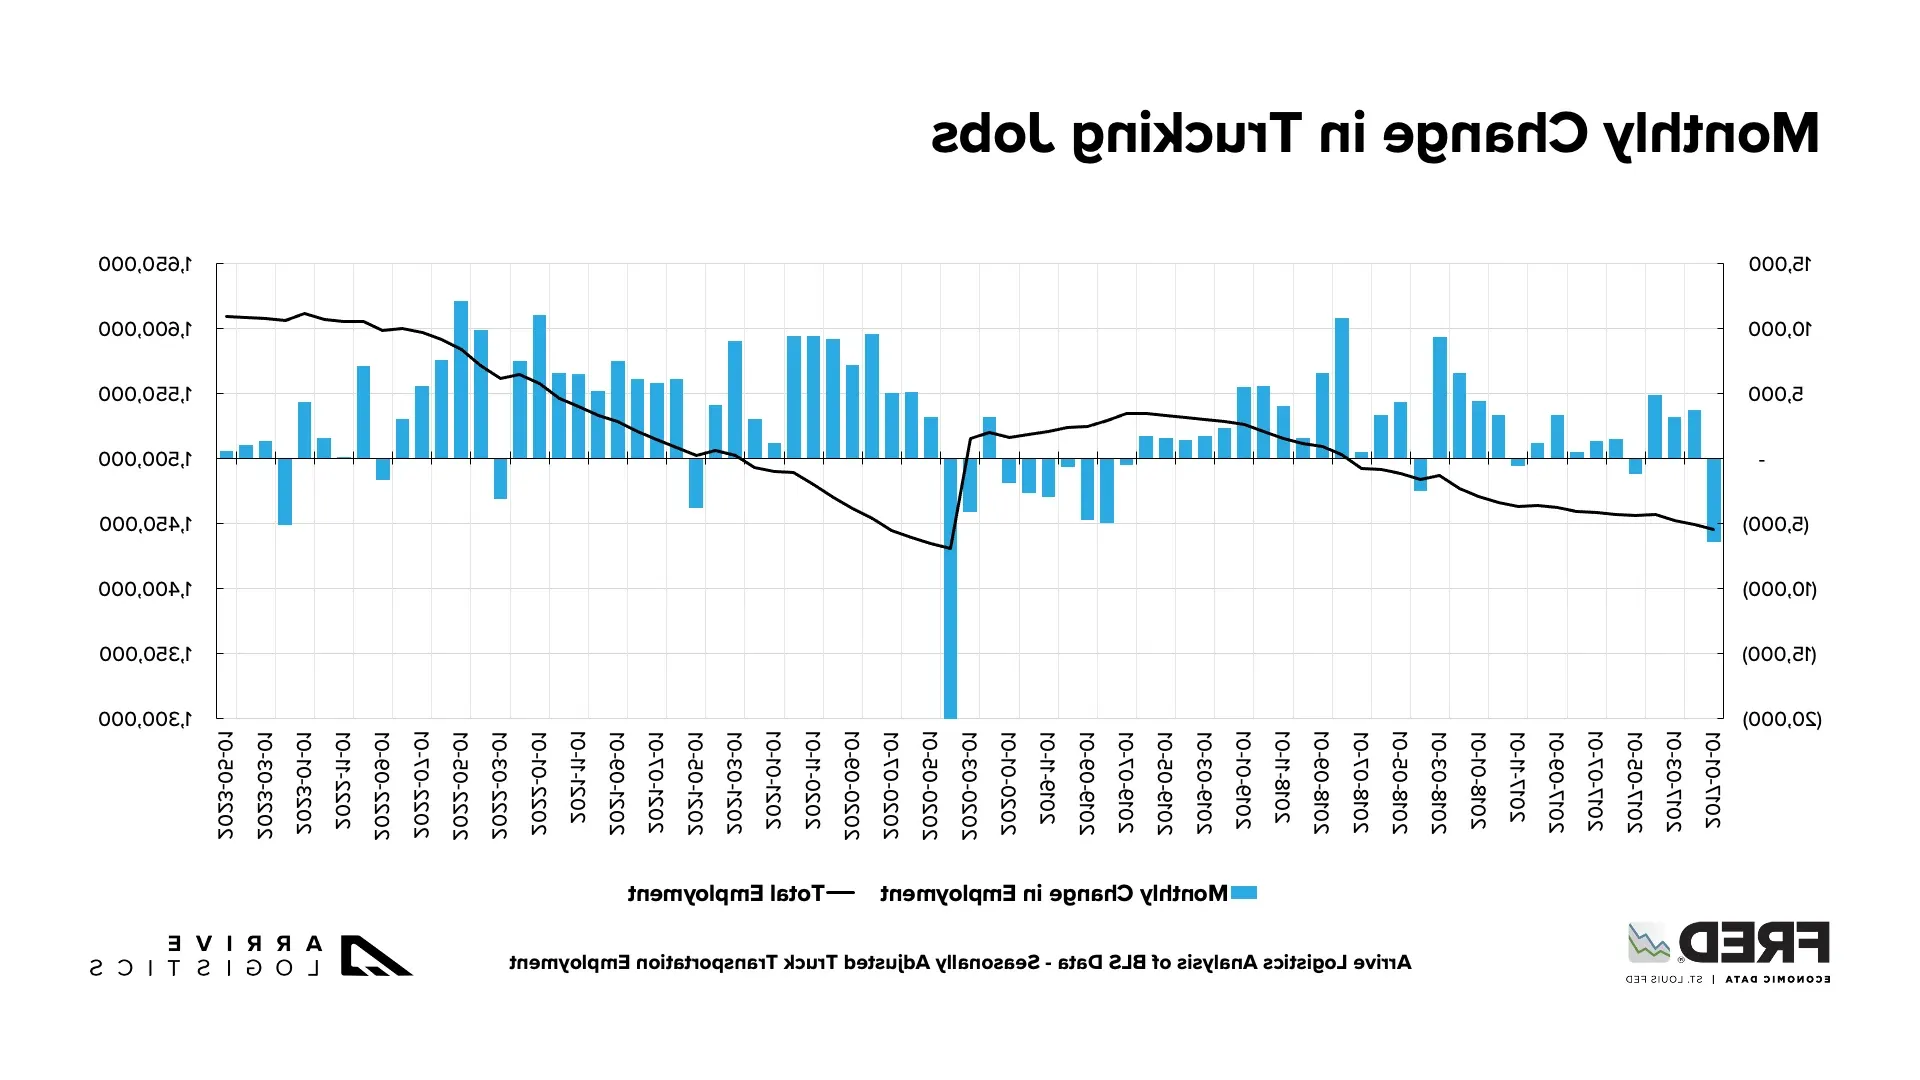 Figure 14: FTR’s Monthly Change in Trucking Jobs
Carriers are happy to see the return of normal summer seasonal demand, especially those who have faced tough conditions over the last year due to high spot market exposure. Improved conditions will likely persist for at least the next month until demand and rates drop again following the July Fourth holiday. This rate ebb and flow through normal seasonal cycles reflects what we expect the spot market to look like through at least early 2024.
Whether or not current conditions are favorable enough to support the capacity surplus on the road today remains to be seen; seasonal opportunities help but may only delay the inevitable correction.
FTR’s Avery Vise recently noted, “During the first five months of 2022, 10 for-hire trucking firms with 100 or more trucks lost authority. During the same period in 2023, 31 carriers with 100 or more trucks lost authority.” While one or two truck operations going under is bad, it is safe to assume their capacity will stay in the market and eventually be absorbed by other firms. However, when a 100-truck operation folds, the impact is much more significant and points to how tough this landscape is for carriers.
Increased operating expenses are the primary culprit causing carriers to close, as overall rates are still high compared with historical (pre-pandemic) levels. This trend continues to drive record-high revocations of authority, with May numbers reaching the second-highest level ever.
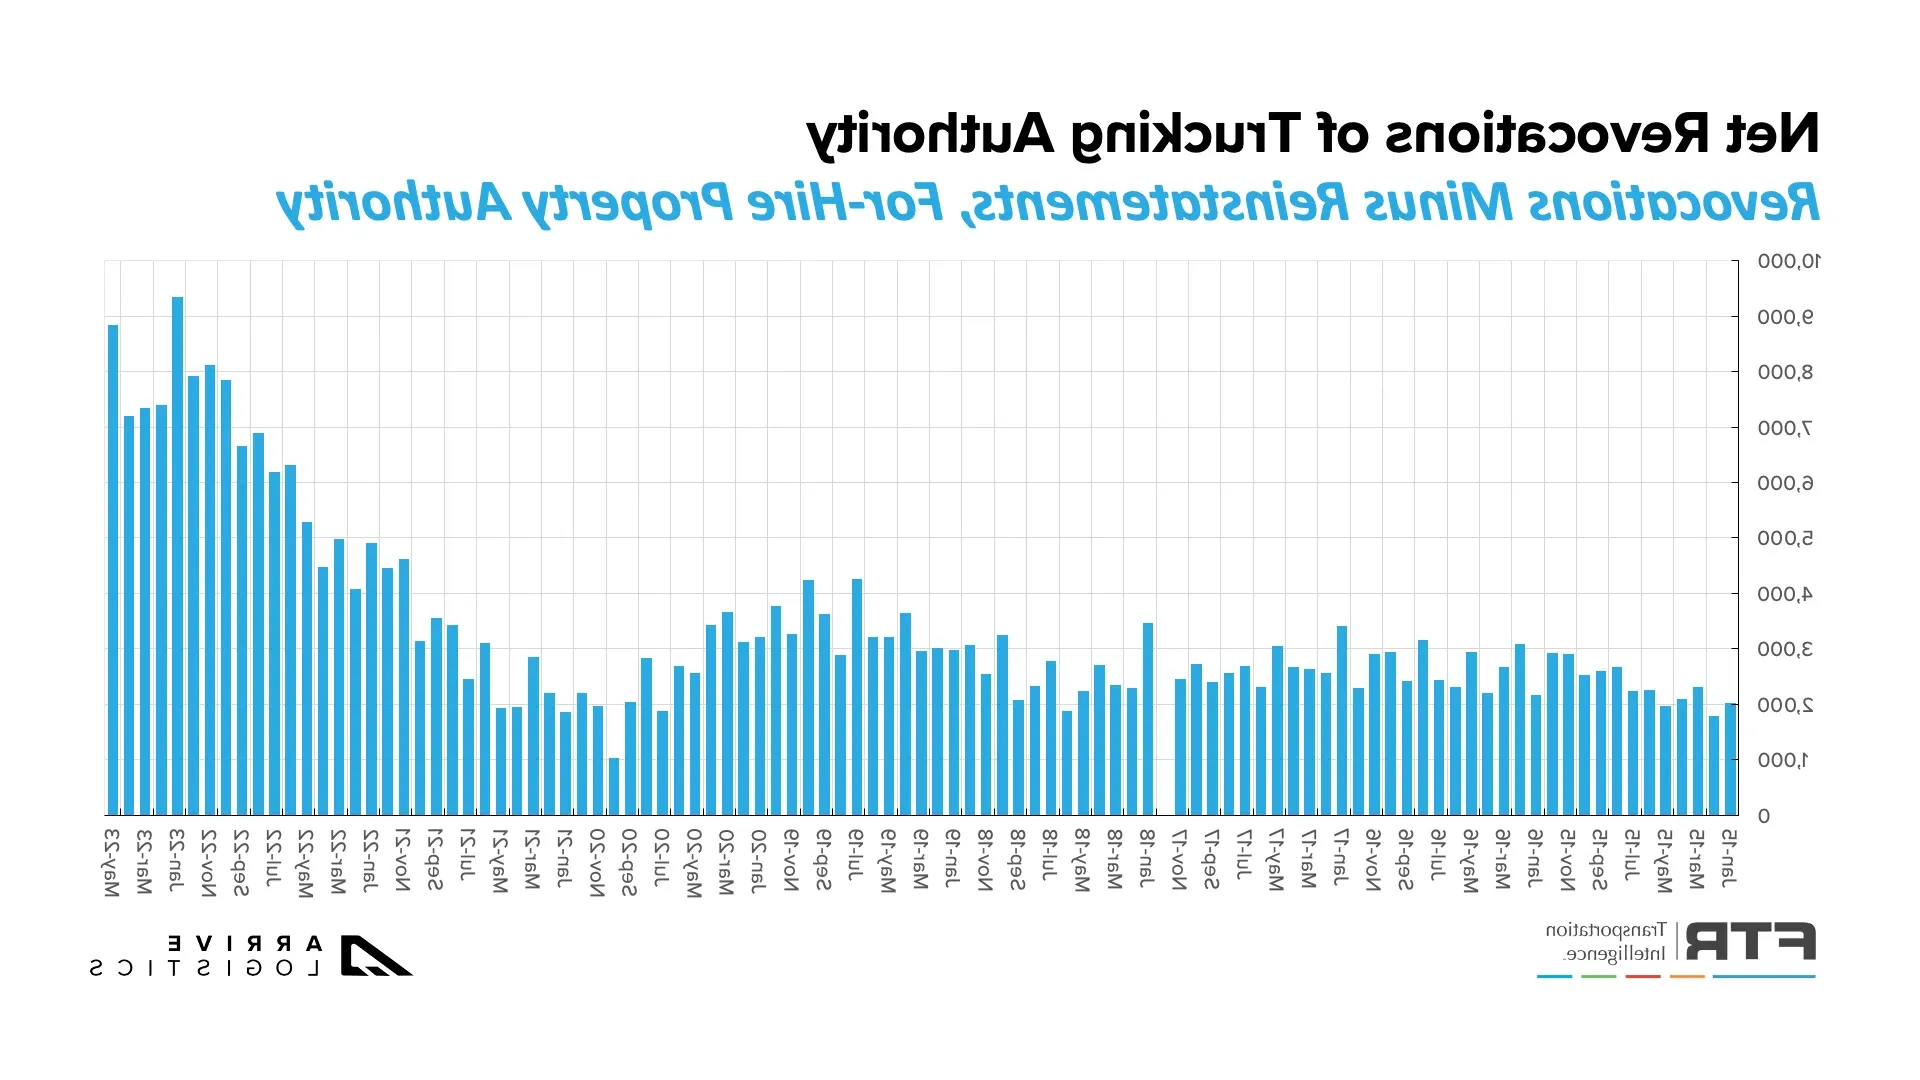 Figure 15: Net Revocations: FTR Analysis of FMCSA Data
ACT’s Driver Availability Index remained flat month-over-month and is currently 60.3. This is the 11th straight reading above 50, marking the longest in the index’s five-year history. It also matches the index’s highest-ever recorded reading, indicating that we have not seen such loose conditions in recent history. However, smaller fleets could see differing trends as owner-operators opt to join larger ones.
We continue to report on retail and manufacturing trends due to their significant impact on domestic freight demand. Recent data indicated a concerning outlook for both sectors. Manufacturing contracted for the seventh consecutive month, while imports have significantly declined from the record-setting levels observed a year ago.
The National Retail Federation (NRF) recently reported that import cargo volume at the nation’s major container ports could be 22% lower through the first half of 2023 than last year. According to the latest update from its Global Port Tracker, “Import container shipments have returned to the pre-pandemic levels seen in 2019 and appear likely to stay there for a while.” In the same report, the NRF took a much less optimistic tone than a month ago regarding labor negotiations at West Coast ports, having recently issued a statement calling on the Biden administration to intervene following reports of disruptions at terminals in Oakland and Long Beach.
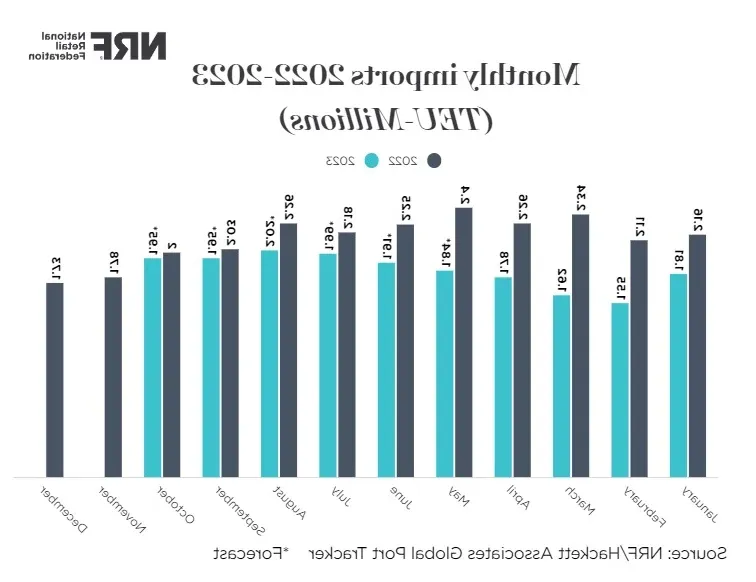 Figure 17: NRF Monthly Imports
The contract versus spot market story stayed mostly consistent in May and June. Shippers still heavily favored contractual freight, and spot posts remain down 61.2% year-over-year, despite a large month-over-month uptick in spot postings. Rather stagnant volumes coupled with abundant capacity indicate spot postings will likely remain well below 2022 levels for the near future.
 Figure 18: DAT Trendlines
Spot rates continue to fall and remain well-below operating costs for public carriers. This is the third straight quarter in which public carriers are seeing negative margins on spot loads. The trend will likely affect owner-operators and carriers with high spot exposure, potentially leading them to close their business or join larger fleets. Historically we would see a quick rise in spot rates when this occurs. However, capacity is still high despite this trend, indicating that conditions could remain rough in the near future.
 Figure 19: ACT Illustrative Spot Operating Margin
When looking at the full scope of public carriers’ businesses, 2022 margins were strong but notably down from the last two years. As rates fall further in 2023, the revenue per mile and cost per mile gap will continue to shrink, meaning margins for large carriers might also drop. However, fuel prices continue to decline, which ultimately decreases costs and could help support margins for all carriers.
 Figure 20: ACT Revenue/Mile vs. Cost/Mile (Publicly Traded Carriers)
June MTD linehaul data shows van, reefer and flatbed spot rates trending upward while contract rates remain relatively steady.
The van rate spread decreased month-over-month to $0.51 between spot and contract. As a result, downward pressure on contract rates should continue for the foreseeable future, even if the market experiences some seasonal pressures in the back half of the second quarter.
Linehaul spot rates are down nearly 14% year over year, and linehaul contract rates are down 14.6%. The year-over-year difference for spot linehaul rates will likely decrease as rates are expected to rise during summer.
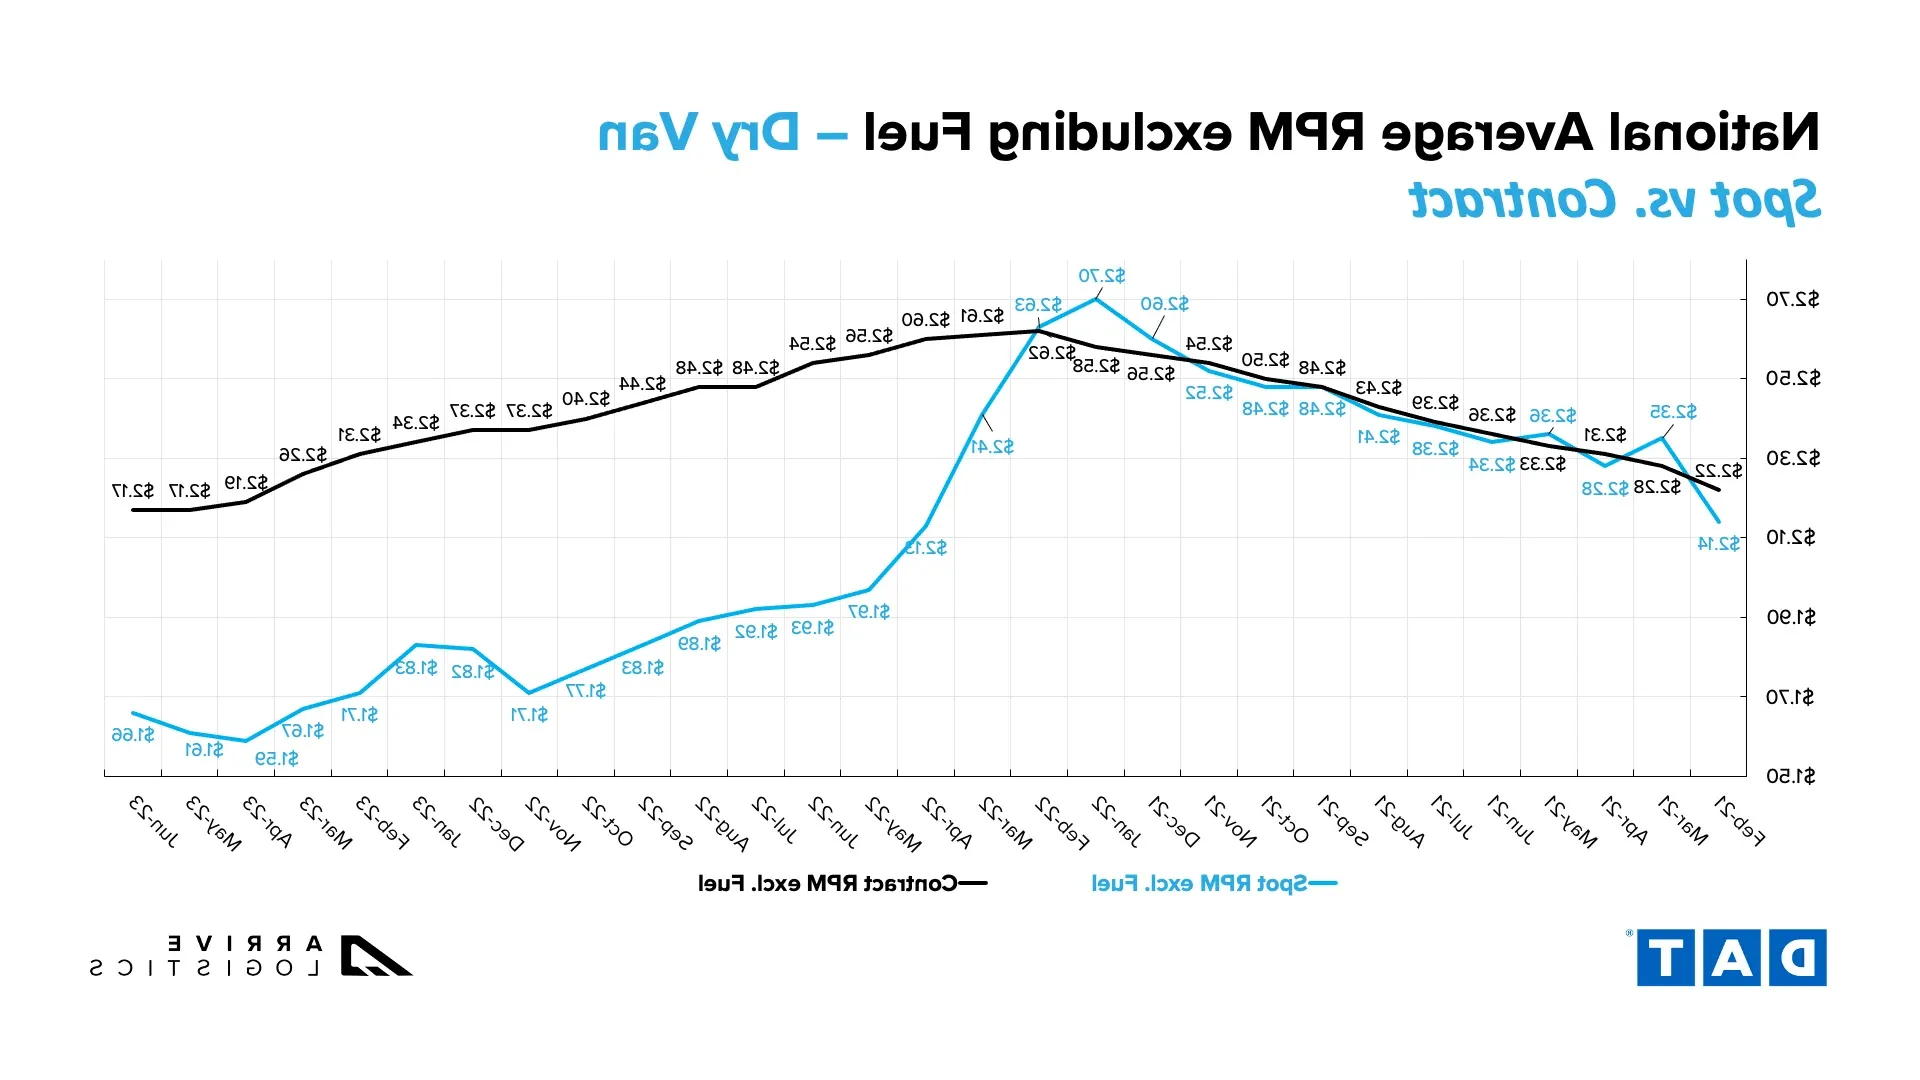 Figure 21: DAT Dry Van National Average RPM Spot vs. Contract
Rate volatility has increased recently in certain markets. Last week, three markets experienced double-digit rate increases: Twin Falls, ID, Huntington, WV and San Diego, CA. These numbers are based on DAT rate-per-mile data and do not include fuel surcharges.
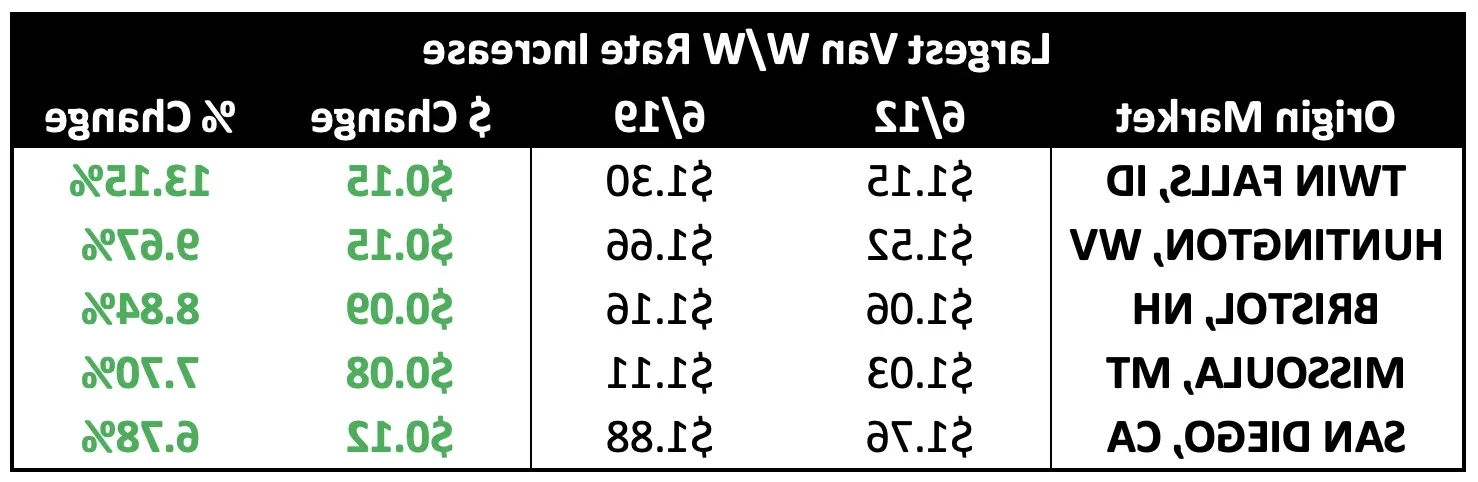 Figure 22: Largest Van W/W Rate Increases
The chart below shows that several markets experienced significant week-over-week rate decreases. The largest occurred in Flagstaff, Arizona, where rates dropped by $0.52 per mile. Rates also dropped by more than $0.20 per mile in Lubbock, TX and North Platte, NE.
 Figure 23: Largest Van W/W Rate Decreases
Reefer spot linehaul rates are following a pattern similar to van rates early in the month, with spot rates beginning to rise. As the month rolls on, the most likely scenario is reefer spot rates increasing as the produce season ramps up.
Down 12.4% year-over-year, the current reefer contract rate is $2.40 per mile, excluding fuel, while the current reefer spot rate is down nearly 9.4% year-over-year to $2.02 per mile, excluding fuel. Despite the significant trend, we have likely passed peak year-over-year deflationary pressures.
 Figure 24: DAT Temp Control National Average RPM Spot vs. Contract
As expected, reefer rates have been more volatile than dry van rates based on the freight type and low demand. These seemingly small changes are making a significant impact. For example, rates jumped by over 50% in New Orleans, LA and Knoxville, TN, amounting to increases of $0.66 and $0.68, respectively.
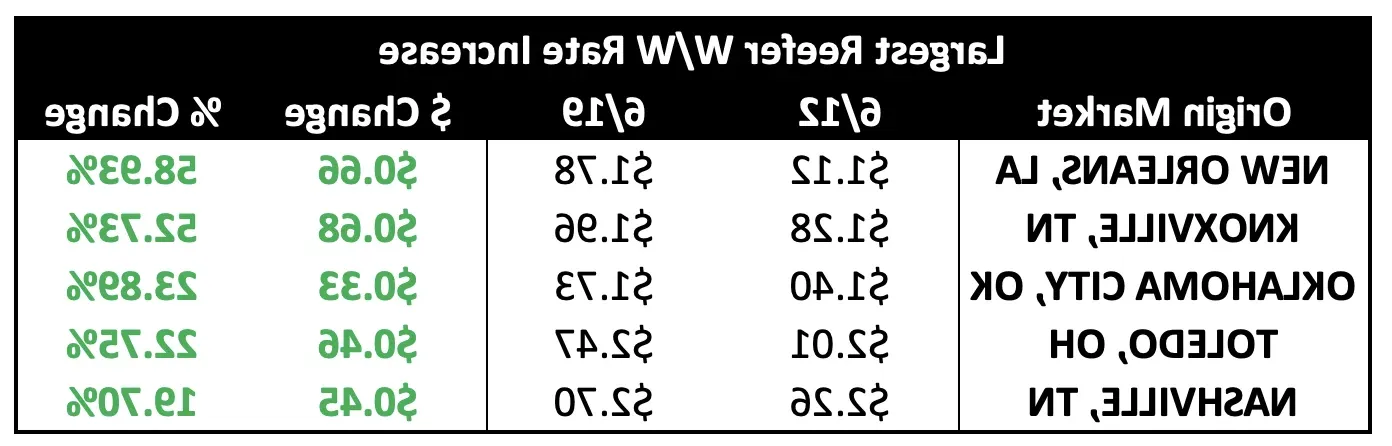 Figure 25: Largest Reefer W/W Rate Increases
Conversely, several markets experienced declining reefer rates. The largest occurred in Shreveport, LA, where rates dropped from $2.30 per mile excluding fuel to $1.72 per mile excluding fuel. Rates also dropped by more than 24% in Amarillo, TX, Hartford, CT and Augusta, ME.
 Figure 26: Largest Reefer W/W Rate Decreases
Thanks partly to the return of warm weather and the onset of construction season, June spot flatbed rates increased by $0.01 per mile, while contract rates appear to have returned to February levels. Spot rates landed at $2.13 and contract at $2.75, excluding fuel.
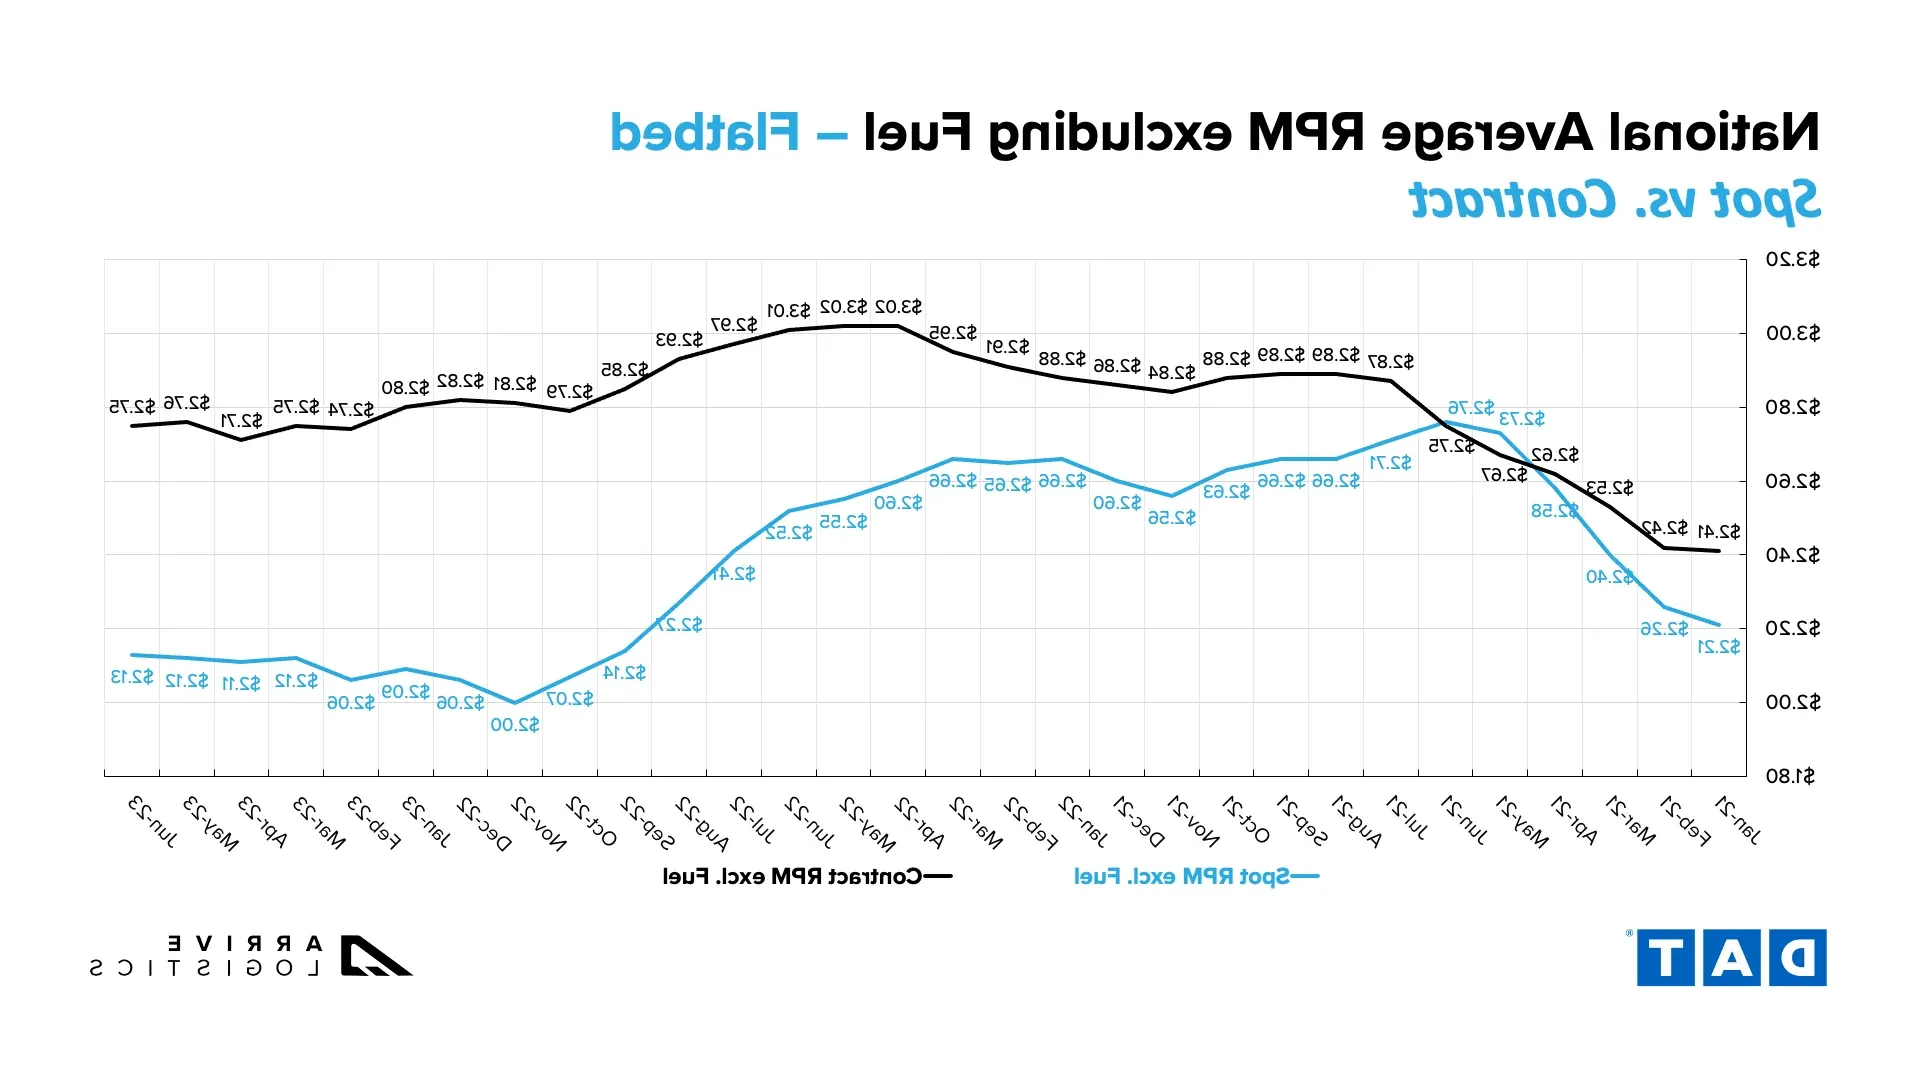 Figure 27: DAT Flatbed National Average RPM Spot vs. Contract
June CPI data showed inflation slowed for the eleventh consecutive month in May, falling to 4.0% year-over-year growth (5.3% excluding food and energy). The data will give the Fed much to consider when they meet to decide whether or not to continue raising interest rates. Many believe there has not been enough disinflation to pause rate hikes for at least one session to see how prices react. Ultimately, slowing or reversing course on rate hikes positively affects future freight demand.
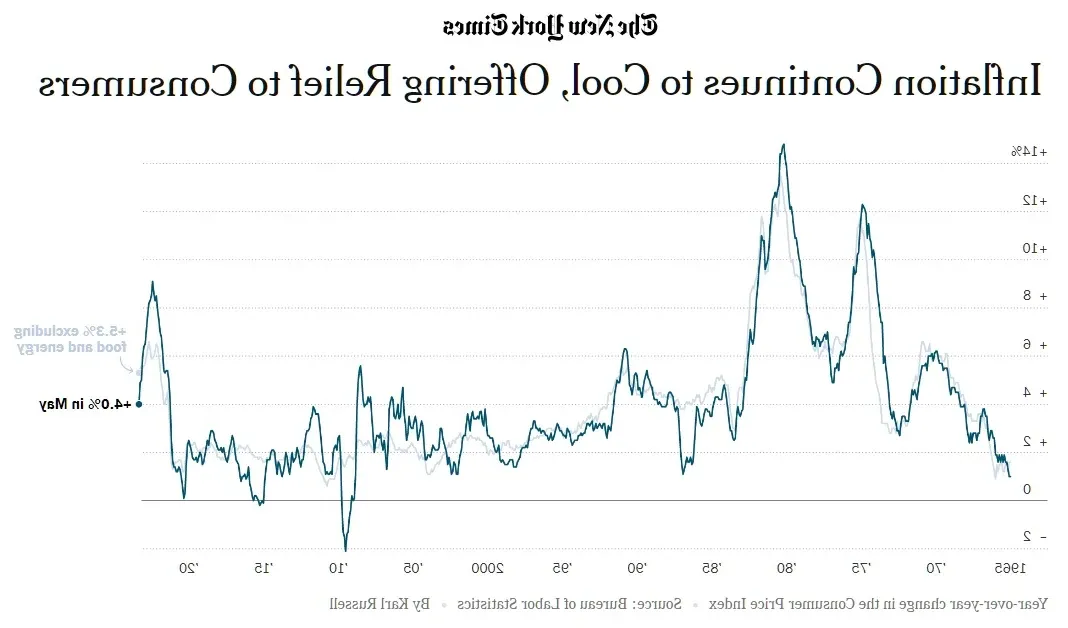 Figure 28: New York Times Inflation Data
Fuel prices continue to drop, a sharp contrast from this time last year. The national diesel average has consistently declined over the past four months and now sits at $3.815 per gallon. As global crude oil prices fall, fuel prices will continue to experience slight declines in the near future.
 Figure 29: National Average Diesel Rates & DAT Fuel Surcharge RPM
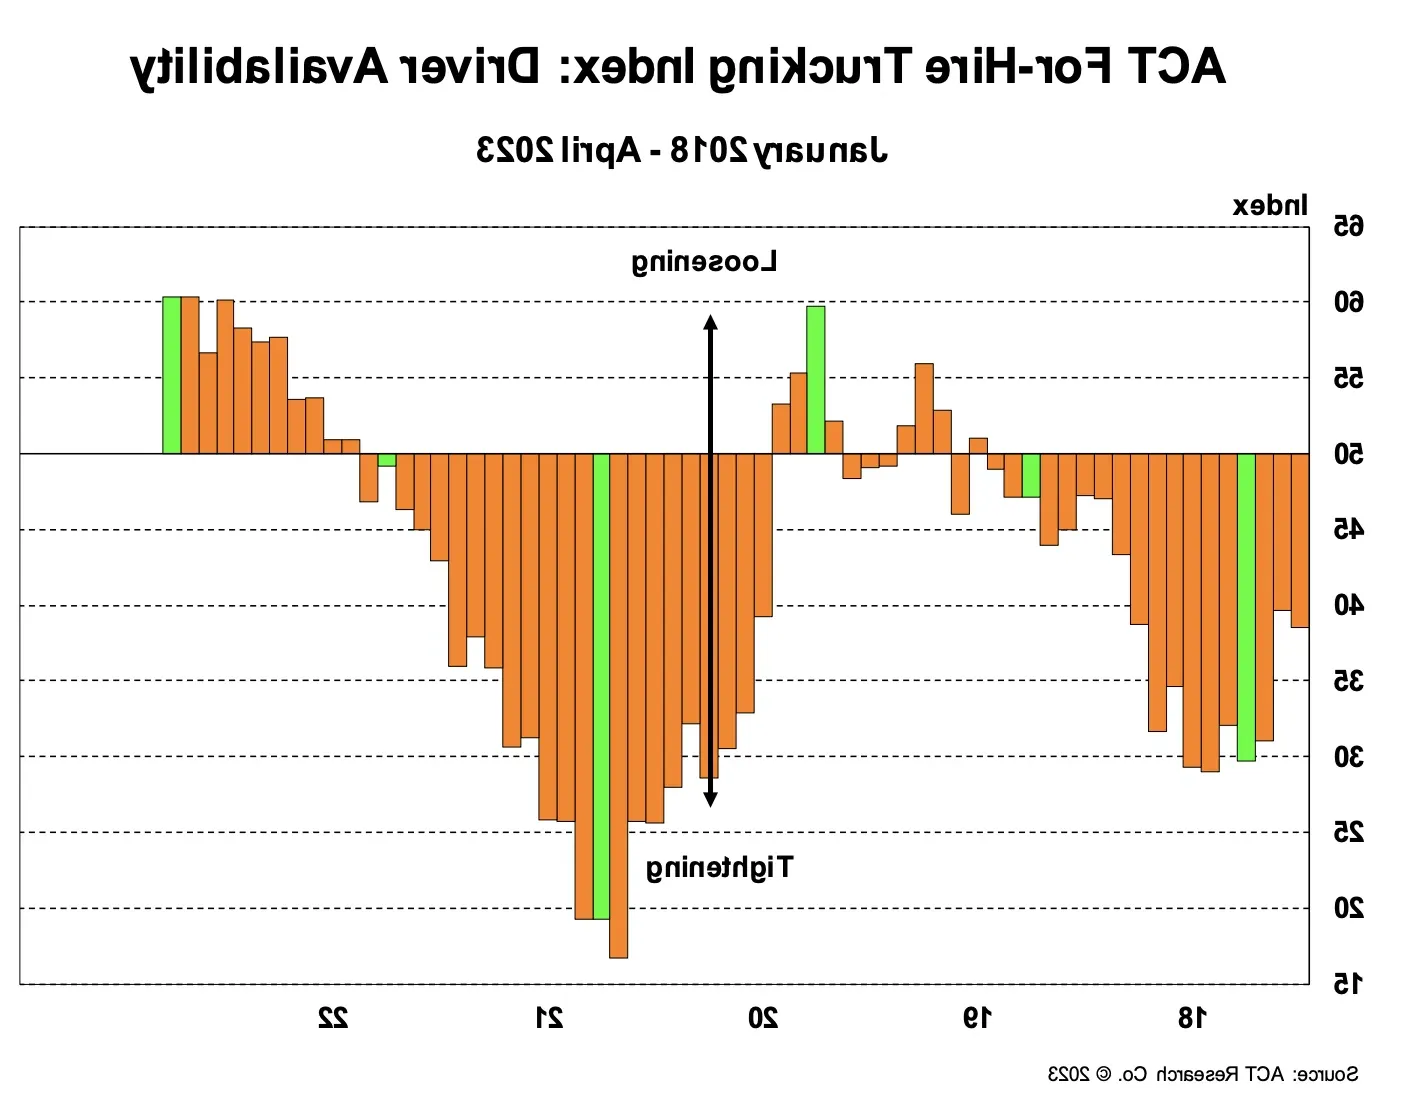 Figure 16: